title: “Stream custom logs files with Fluentd sidecar”
date: 2022-05-31T14:59:51
slug: stream-custom-logs-files-with-fluentd-sidecar
Stream custom logs files with Fluentd sidecar on OpenShift
According to the twelve factor app, it is recommended to stream the logs on stdout. But in some cases, logs are not managed in this way. For example, in the case of middleware, the logs are written inside log files. You could not change this behaviour as you get the container from a third party.
So, on OpenShift, how to get these logs, written on files ?
This article gives you a way to retrieve these logs, written in files, and send them to your log systems. It is based on the use of sidecar that is deployed with the application.
The sample application
To illustrate this article, I’m using a sample application generating some logs in a file. The application code could be located here. It is a simple application written in Go lang.
The logs behaviour could be customised by using environment variables. The LOG variable defines the level of log (debug, info ….). The LOGFILE variable defines where the output of the log will be made. If LOGFILE is empty, stdout is used otherwise, the file referred by the variable is used to collect the logs.
A docker image, including the application is available on docker hub. The image is jtarte/logsample. The building of the image configures the credentials to allow writing on /var/app .
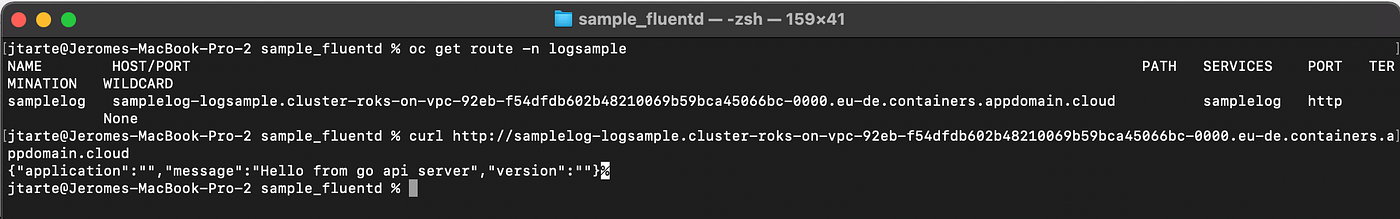
The deployments I use in this article define the application (deployment, pod, service …) and its associated route. You could retrieve the generated route by using oc command. By using a curl command on this route, you could generate workload on the application. For each call, some entries on the log files will be generated.
oc get route -n logsample
curl http://<route\_name>
Deployment of the application
First, you must have an OpenShift cluster configured with the EFK stack. You could find instruction to deploy OpenShift Logging here.
My deployment is done on the logsample namespace. But the namespace where the application is deployed has no impact on the test described in this article.
I deploy the application as is, whithout any sidecar. To do the deployment , I use the following file.
oc apply -f deployment\_simple.yaml -n logsample
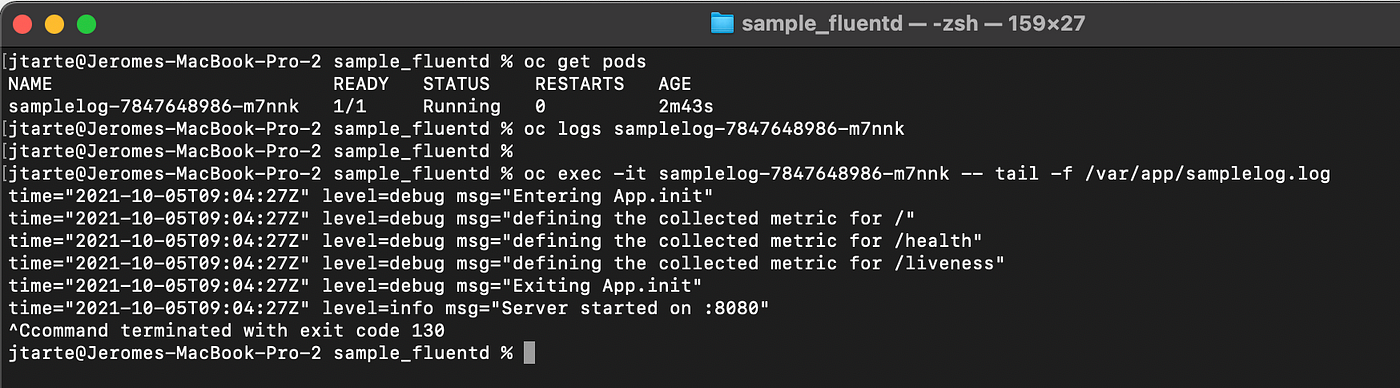
If I check the log in the pods using oc log command, nothing is displayed. It is the expected behaviour as the logs are not sent to stdout but on a log file.
oc get pods -n logsample
oc logs <pod\_id> -n logsample
But if I stream the log from the logfile, I could see the log generated by the application.
oc exec-it <pod\_id> -- tail -f /var/app/samplelog.log
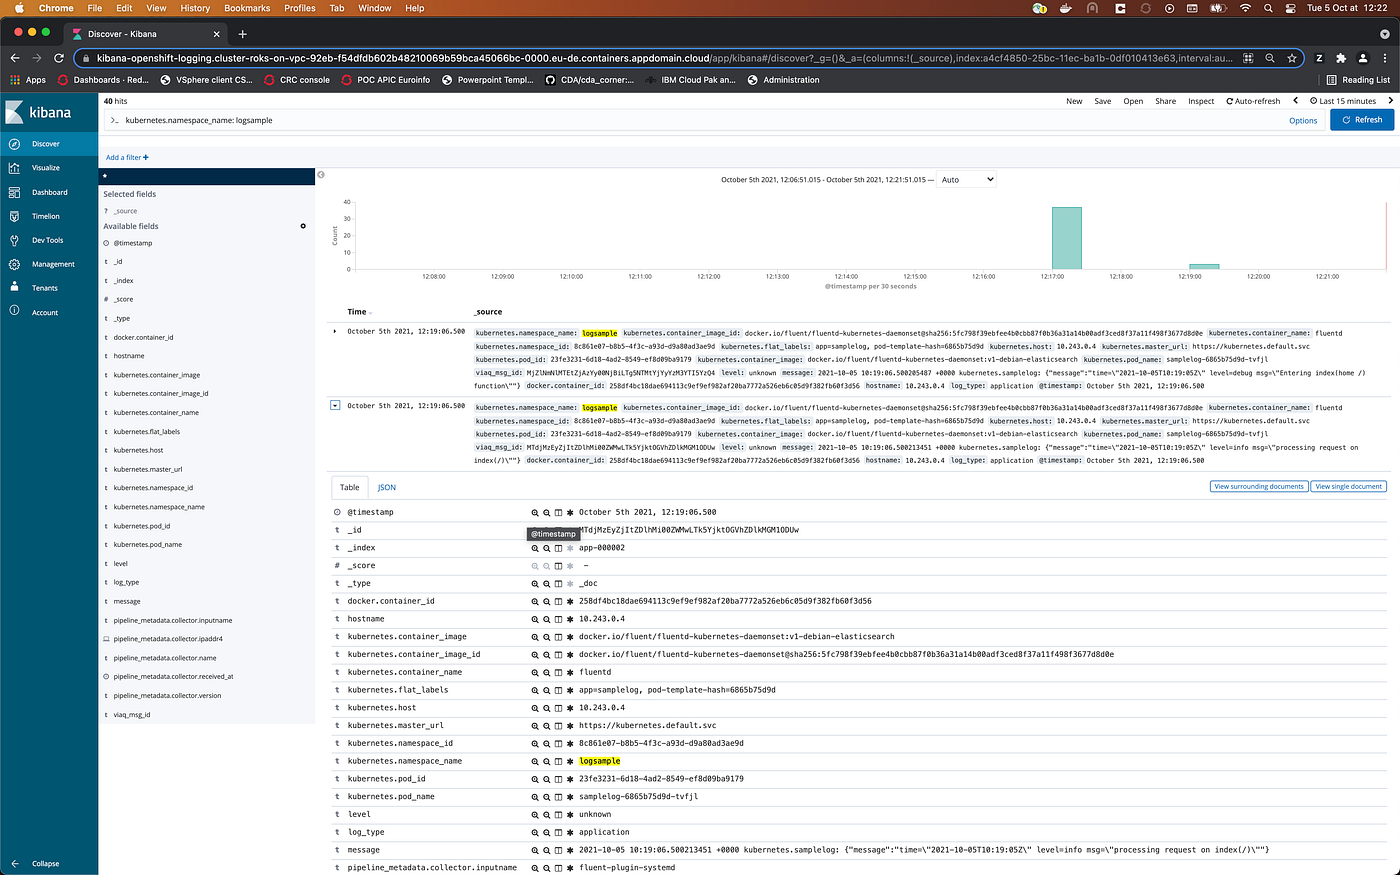
And of course, if I do a search about samplelog on Kibana, the only entries I see are related to the deployment of the application that has samplelog as name. Nothing about application logs.
You could clean the environment by using the command:
oc delete -f deployment\_simple -n logsample
Use of a Fluentd sidecar to forward logs on stdout
The solution to collect the application logs, stored in a file, is to use a sidecar. It reads the logs file and streams its contents on its own stdout. In that way, the log messages, generated by the application, are streamed like all the other on stdout and could be collected by the standard EFK stack of the cluster.
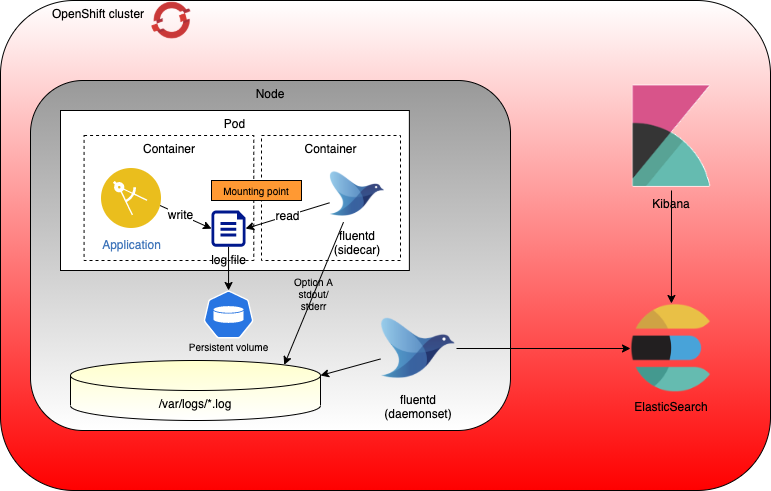
The sidecar in the solution is a Fluentd container that is deployed inside the same pod than the application. The two containers share common files system that is defined on each of them as mounting point. In my sample, it is /var/app , know as applog .
spec:
containers:
- name: samplelog
image: jtarte/logsample:latest
imagePullPolicy: "Always"
ports:
- containerPort: 8080
env:
- name: LOG
value: DEBUG
- name: LOGFILE
value: /var/app/samplelog.log
volumeMounts:
- name: applog
mountPath: /var/app/
- name: fluentd
image: fluent/fluentd-kubernetes-daemonset:v1-debian-elasticsearch
env:
- name: FLUENT\_UID
value: "0"
volumeMounts:
- name: fluentd-config
mountPath: /fluentd/etc/fluent.conf
subPath: fluent.conf
- name: applog
mountPath: /var/app/
volumes:
- name: applog
emptyDir: {}
- name: fluentd-config
configMap:
name: fluentd-config
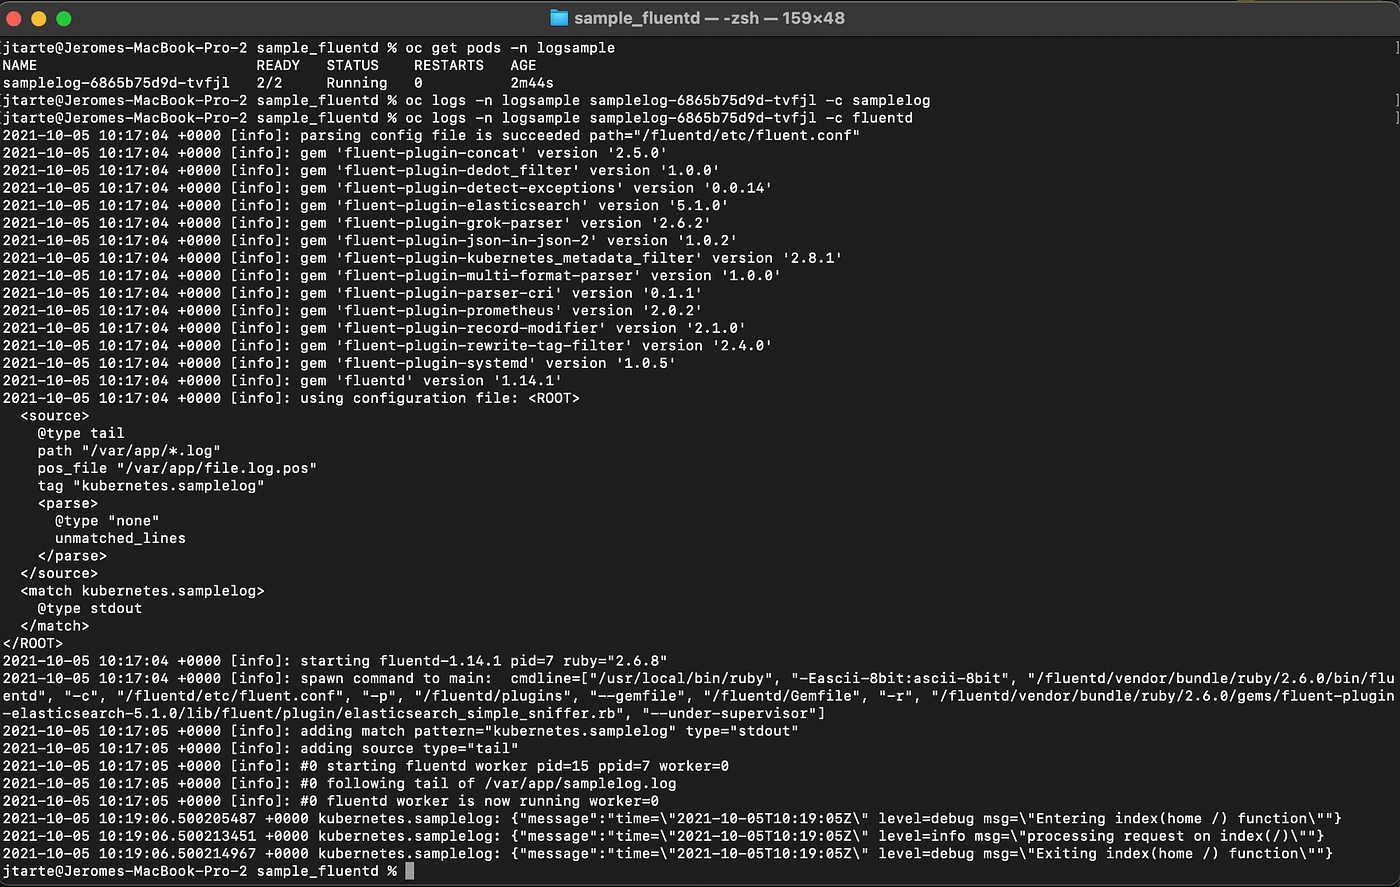
Fluentd behaviour is described into a configuration file, fluent.conf. On my deployment, I use a ConfigMap to store this configuration.
fluent.conf: |
<source>
@type tail
path "/var/app/\*.log"
pos\_file "/var/app/file.log.pos"
tag "kubernetes.samplelog"
<parse>
@type none
</parse>
</source><match kubernetes.samplelog>
@type stdout
</match>
This config is simple. The <source> defines the log collection. The path parameter locates where the logs are. The pos_file is an index managed by fluentd. It gives the position in the logs file from where the next log should be collected. The use of this index ensure that an entry on the log files is processed only one time.
The outpout is very simple as the sample does just a copy on the stdout of the container.
To do the deployment, I use the following file.
oc apply -f kube/deployment\_sidecar\_stdout.yaml
If you are willing to check the logs of the two containers, you could use the following commands:
oc get pods -n logsample
oc logs <pod\_id> -n logsample -c samplelog
oc logs <pod\_id> -n logsample -c fluentd
Nothing is seen inside the samplelog container, as expected because the logs are written into a file. But on the fluentd container, you could see the content of your application logs as it is streamed on stdout by the Fluentd process.
And if you go on the Kibana interface, you could now see logs from samplelog inside all the logs entries.
You could clean the environment by using the command:
oc delete -f deployment\_sidecar\_stdout -n logsample
Use of a Fluentd sidecar to forward logs directly to Elastic
Streaming the logs to stdout is probably better. But sometimes, you may have specific requirements to target a specific log system. Fluentd sidecar could also be used to forward the logs directly to a log management system endpoint. This option may offer some features to customise / manage the forwarded logs. It is done by the sidecar.
The following example is, may be, simple but it will illustrate how to forward logs from the sidecar to the Elasticsearch, deployed on the platform. The process could be similar for an external Eleasticsearch instance. I did it with the one deployed one cluster in order to simplify the exercise and not to have to deploy a second Elasticsearch cluster.

The first step is to get the certificates used to connect Elasticsearch. You get them from the EFK stack configured on the platform.
oc get secret -n openshift-logging fluentd -o jsonpath='{.data.ca-bundle\.crt}' | base64 -d > ca-bundle.crt
oc get secret -n openshift-logging fluentd -o jsonpath='{.data.tls\.crt}' | base64 -d > tls.crt
oc get secret -n openshift-logging fluentd -o jsonpath='{.data.tls\.key}' | base64 -d > tls.key
Then, with the collected certificates, you could create a secret used by the sidecar. It uses the certificates embedded into the secret to manage the authentication to the Elasticsearch instance.
oc create secret generic fluentd --type='opaque' --from-file=ca-bundle.crt=./ca-bundle.crt --from-file=tls.crt=./tls.crt --from-file=tls.key=./tls.key
This secret is used by the Fluentd container definition.
The main difference with the previous case is the configuration of the Fluentd process. It is described inside the ConfigMap. The changes provide information to connect to Elasticsearch service and to forward the log. The logstash parameters are used to defined an index that will be added to the Elasticsearch entry.
<source>
@type tail
path "/var/app/\*.log"
pos\_file "/var/app/file.log.pos"
tag "kubernetes.samplelog"
<parse>
@type none
</parse>
</source><match kubernetes.samplelog>
@type elasticsearch
host elasticsearch.openshift-logging.svc
port 9200
scheme https
ssl\_version TLSv1\_2
client\_key '/var/run/ocp-collector/secrets/fluentd/tls.key'
client\_cert '/var/run/ocp-collector/secrets/fluentd/tls.crt'
ca\_file '/var/run/ocp-collector/secrets/fluentd/ca-bundle.crt'
logstash\_format true
logstash\_prefix samplelog
</match>
To do the deployment, I use the following deployment file.
oc apply -f kube/deployment\_sidecar\_EFK.yaml
After having generate some requests on the application, on Kibana, you could configure a new index named samplelog-*. By filtering the logs with this index, you will see, on the screen, the logs entries related to samplelog application.
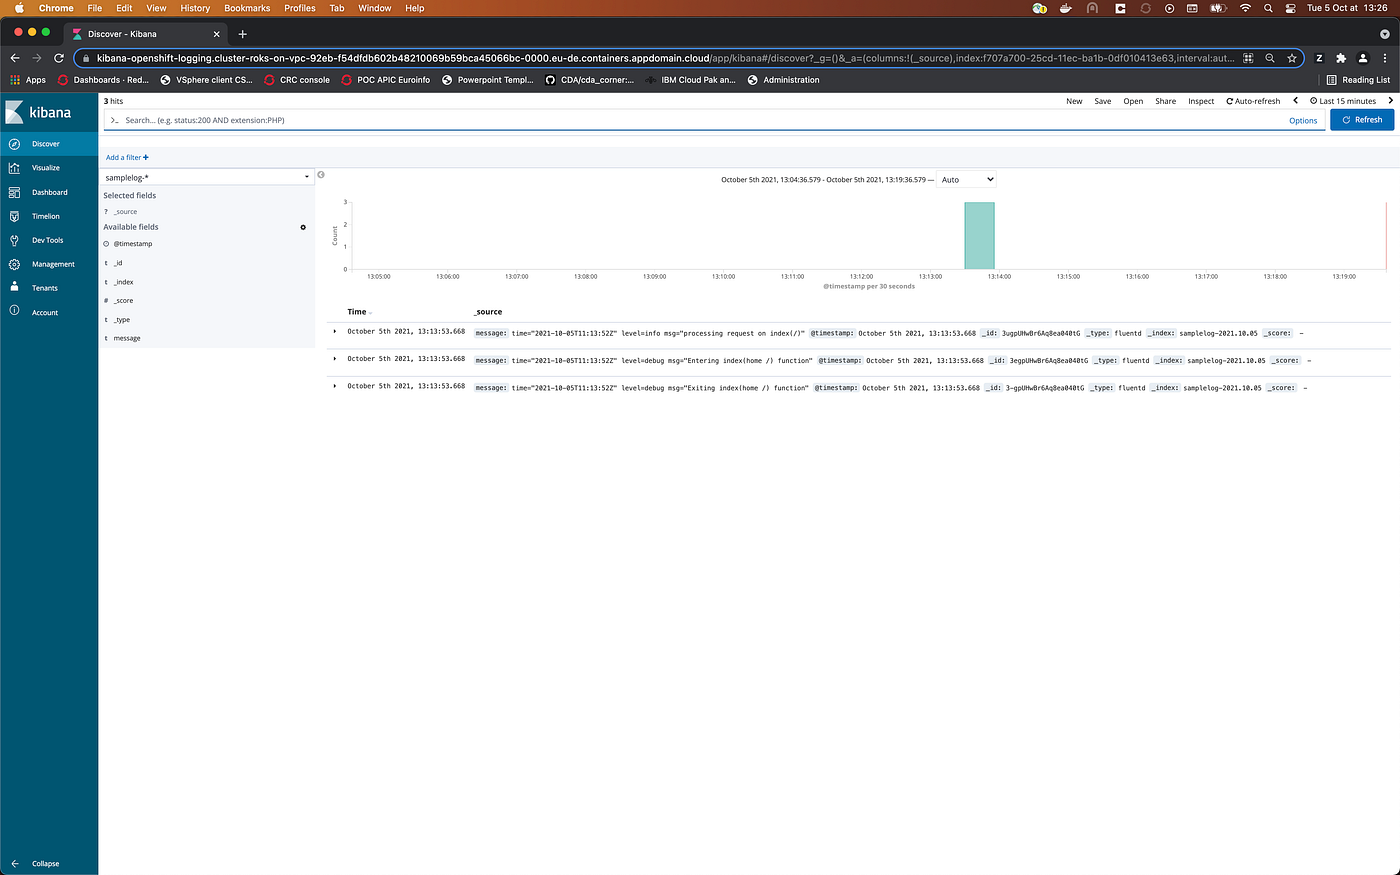
The entries, here, are different from the previous try. This time, the entries are formatted by the Fluentd sidecar. The purpose of this article is not to enter in detail of the configuration of Fluentd. If you wish more details on this configuration, you could check the Fluentd documentation.
You could clean the environment by using the command:
oc delete -f deployment\_sidecar\_EFK.yaml -n logsample
Conclusion
This article show a way to retrieve the logs, stored into files inside an application/middlware container. The option to stream the content of log files on stdout is probably better as it is more aligned with what the platform does. It offers loose coupling as it doesn’t have dependencies with a target.
But in some cases, you may have to forward the logs to a specific target and the use of a sidecar could be an option.
So with the processes described in this article, you have a way to get all the logs of your application, even if they are written into files. And you are able to send them to the same place than your standard stdout logs.
References