Category Archives: Kubernetes

VictoriaMetrics


title: “VictoriaMetrics”
date: 2023-06-01T14:30:08
slug: victoriametrics


What makes VictoriaMetrics the next leading choice for open-source monitoring

Amit Karni

Everything Full Stack

Amit Karni

·

Follow

Published in

Everything Full Stack

·

6 min read

·

May 10, 2022

727

2

During the last years, the de-facto standard choice for open-source monitoring has been the Prometheus-stack combined with Grafana, Alermanager, and various types of exporters.
At the time, it was a pretty decent stack.
Today, though, in a fast-growing ecosystem, it has problems:

Recently, I was asked to review, design and deploy a monitoring solution to switch/extend the current Prometheus stack.
The solution should be high-performancehighly-available, cheap, redundant, scalable, backupable, and can store high data retention.

After researching a few solutions like ThanosCortexGrafana-Mimir, and VictoriaMetrics.
It’s clear to say that in my opinion, VictoriaMetrics is the winnerand the best fit for my purposes & needs.

Why VictoriaMetrics?

WhileThanos,Cortex,andGrafanaMimirare designed toextendthe old Prometheus stack with HA and long-term storage capabilities.

VictoriaMetrics seems to take Prometheus Stack and break it into micro-services architecture using stronger and better new components.It has high availability built-in, as well as superior performance & data compression compared to the Prometheus stack, Scaling is very easy since every component is separate and most of the components are stateless, which means it can be designed to run on spot nodes and reduce costs.
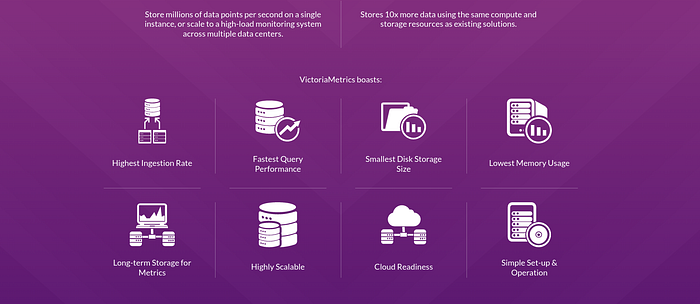
VictoriaMetrics cluster Architecture

VictoriaMetrics can be deployed as a single server or as a cluster version, I chose to deploy the VictoriaMetrics-cluster on k8s. (using Helm-charts)

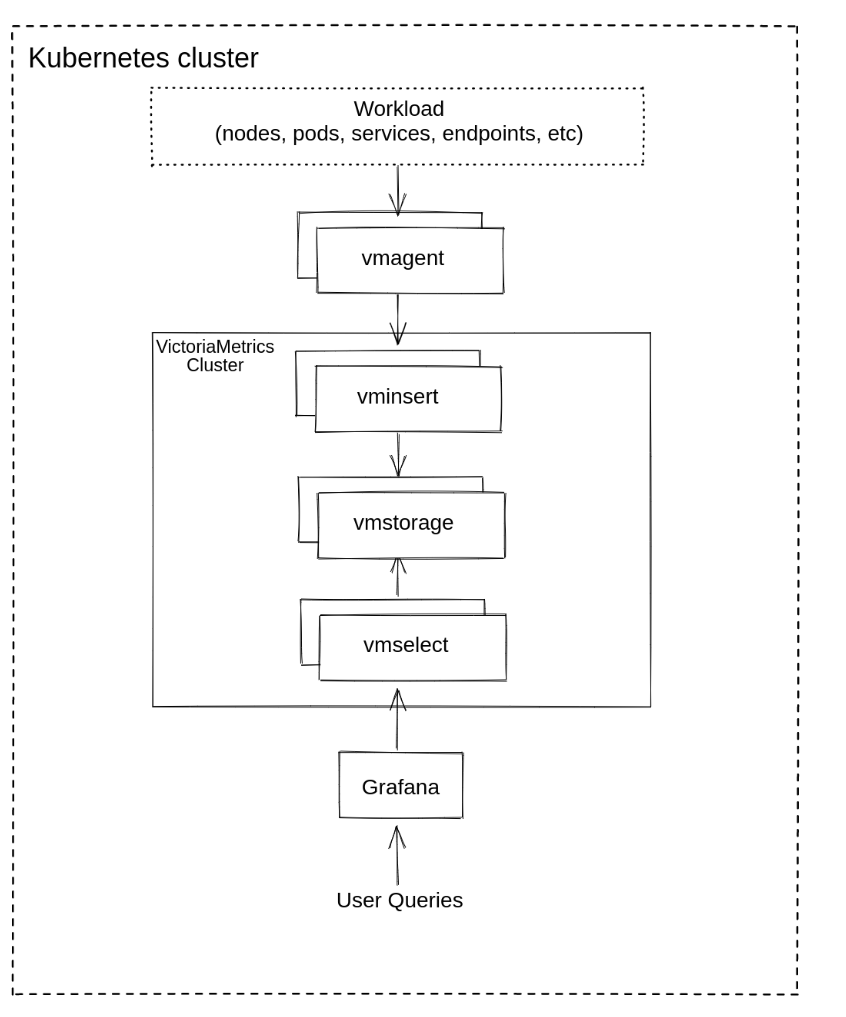
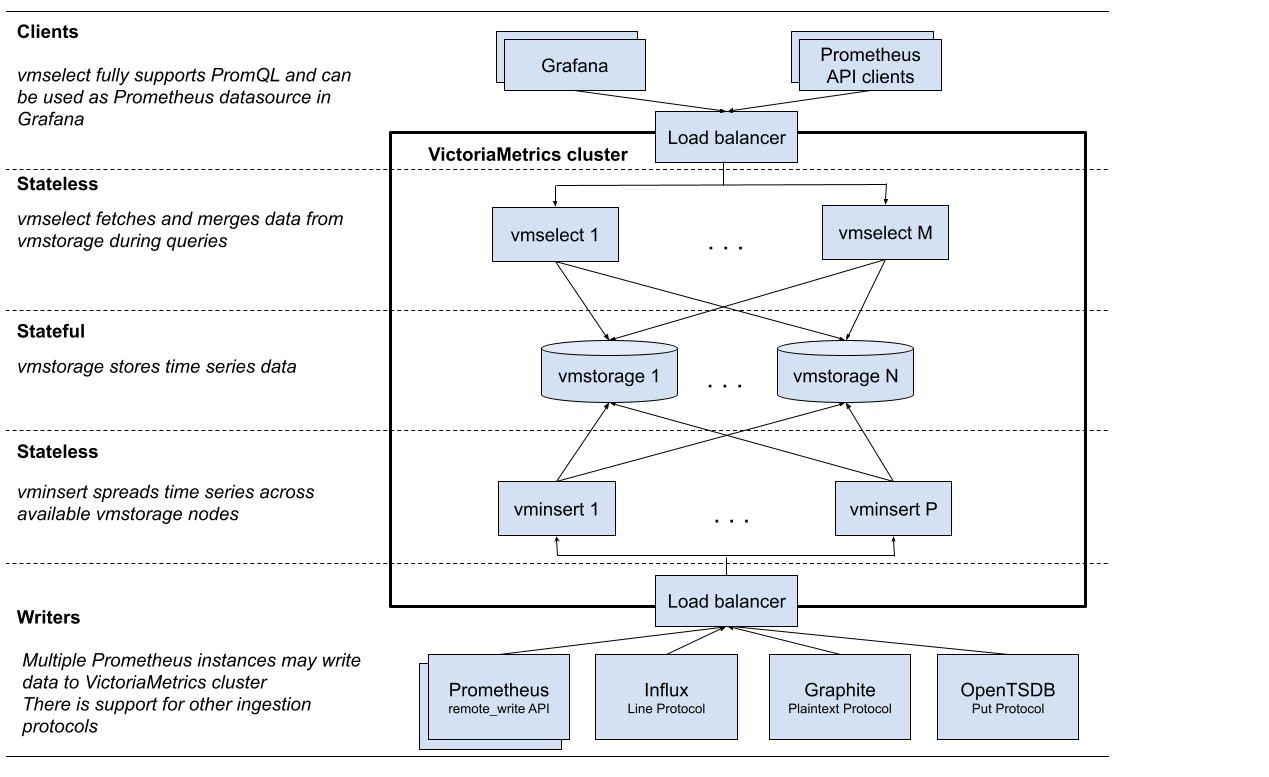
  • vmstorage: stores the raw data and returns the queried data on the given time range for the given label filters. This is the only stateful component in the cluster.
  • vminsert: accepts the ingested data and spreads it among vmstorage nodes according to consistent hashing over metric name and all its labels.
  • vmselect: performs incoming queries by fetching the needed data from all the configured vmstoragenodes
  • vmauth: is a simple auth proxy, router for the cluster. It reads auth credentials from the Authorization HTTP header (Basic AuthBearer token, and InfluxDB authorization is supported), matches them against configs, and proxies incoming HTTP requests to the configured targets.
  • vmagent: is a tiny but mighty agent which helps you collect metrics from various sources and store them in VictoriaMetrics or any other Prometheus-compatible storage systems that support the remote_write protocol.
  • vmalert: executes a list of the given alerting or recording rules against configured data sources. Sending alerting notifications vmalert relies on configured Alertmanager. Recording rules results are persisted via remote write protocol. vmalert is heavily inspired by Prometheus implementation and aims to be compatible with its syntax
  • promxy: used for querying the data from multiple clusters. It’s Prometheus proxy that makes many shards of Prometheus appear as a single API endpoint to the user.

Cluster resizing and scalability

Cluster performance and capacity can be scaled up in two ways:

  • By adding more resources (CPU, RAM, disk IO, disk space, etc..) AKA vertical scalability.
  • By adding more of each component to the cluster AKA horizontal scalability.

The components can all be scaled individually, the only stateful component is the vmstorage component.
Therefore, it’s easier to maintain and scale clusters.
Now, adding new components and updating vminsert configurations is all it takes to scale the storage layer. Nothing else is needed.

Built-in High Availablity

By using the clustered version of VictoriaMetrics, redundancy and auto-healing are built into each component.
Even when some cluster components are temporarily unavailable, the system can continue to accept new incoming data and process new queries.

  • vminsert re-routes incoming data from unavailable vmstorage nodes to healthy vmstorage nodes

Additionally, data is replicated across multiple nodes within the cluster which makes it also redundant.The cluster remains available if at least a single vmstorage node exists

Disaster Recovery best-practice

For better cluster performance, VictoriaMetrics recommends that all components run within the same subnet network (same availability zone) for high bandwidth and low latency.

To achieve DR following VictoriaMetrics best practice, we can run multiple clusters on different AZs or regions, each AZ or region has its own cluster.
*It is necessary to configure vmagentto send data to all clusters.

In the event of an entire AZ/Region going down, Route53 failover and/or Promxy failover can still be used to read and write to other online clusters in another AZ/Region.
As soon as the AZ/region is online again, vmagentwill send its cached data back into that cluster.

Backup & Restore

vmbackup creates VictoriaMetrics data backups from instant snapshots.

Supported storage systems for backups:

  • GCS. Example: gs://<bucket>/<path/to/backup>
  • S3. Example: s3://<bucket>/<path/to/backup>
  • Any S3-compatible storage such as MinIOCeph or Swift. See these docs for details.
  • Local filesystem. Example: fs://</absolute/path/to/backup>. Note that vmbackup prevents from storing the backup into the directory pointed by -storageDataPath command-line flag, since this directory should be managed solely by VictoriaMetrics or vmstorage.

vmbackup supports incremental and full backups. Incremental backups are created automatically if the destination path already contains data from the previous backup.
Full backups can be sped up with -origin pointing to an already existing backup on the same remote storage. In this case vmbackup makes a server-side copy of the shared data between the existing backup and the new backup. It saves time and costs on data transfer.

The backup process can be interrupted at any time, It is automatically resumed from the interruption point when restarting vmbackup with the same args.

Backed-up data can be restored with vmrestore.

Summarizing

In this post, I share the features that I find most interesting, but there are many more that may be of interest to others (multitenancy, for example).

VictoriaMetrics team has done an amazing job redesigning a monitoring tool that uses the commonly used Prometheus-stack monitoring platform but builds-in changes that are appropriate & necessary using micro-services components.

VictoriaMetrics is a fast and scalable open-source time-series database and monitoring solution that lets users build a monitoring platform without scalability issues and minimal operational burden.

additional scrape config prometheus operator


title: “additional scrape config prometheus operator”
date: 2023-05-04T12:20:22
slug: additional-scrape-config-prometheus-operator


Additional Scrape Configuration

AdditionalScrapeConfigs allows specifying a key of a Secret containing additional Prometheus scrape configurations. Scrape configurations specified are appended to the configurations generated by the Prometheus Operator.

Job configurations specified must have the form as specified in the official Prometheus documentation. As scrape configs are appended, the user is responsible to make sure it is valid. Note that using this feature may expose the possibility to break upgrades of Prometheus.

It is advised to review Prometheus release notes to ensure that no incompatible scrape configs are going to break Prometheus after the upgrade.

Creating an additional configuration

First, you will need to create the additional configuration. Below we are making a simple “prometheus” config. Name this prometheus-additional.yaml or something similar.

- job\_name: "prometheus"
static\_configs:
- targets: ["localhost:9090"]

Then you will need to make a secret out of this configuration.

kubectl create secret generic additional-scrape-configs --from-file=prometheus-additional.yaml --dry-run=client -oyaml > additional-scrape-configs.yaml

Next, apply the generated kubernetes manifest

kubectl apply -f additional-scrape-configs.yaml -n monitoring

Finally, reference this additional configuration in your prometheus.yaml CRD.

apiVersion: monitoring.coreos.com/v1
kind: Prometheus
metadata:
name: prometheus
labels:
prometheus: prometheus
spec:
replicas: 2
serviceAccountName: prometheus
serviceMonitorSelector:
matchLabels:
team: frontend
additionalScrapeConfigs:
name: additional-scrape-configs
key: prometheus-additional.yaml

ProxySQL


title: “ProxySQL”
date: 2022-12-08T09:15:17
slug: proxysql


apiVersion: monitoring.coreos.com/v1
kind: ServiceMonitor
metadata:
name: proxysqlcluster
namespace: squad-rtlplus-podcast
labels:
prometheus: r5s-shared
spec:
endpoints:
– path: /metrics
port: proxysql-exp
jobLabel: app
namespaceSelector:
matchNames:
– squad-rtlplus-podcast
selector:
matchLabels:
app: proxysql-exporter

Configmap:

apiVersion: v1
data:
proxysql.cnf: |
datadir=”/var/lib/proxysql”
errorlog=”/var/lib/proxysql/proxysql.log”
admin_variables=
{
admin_credentials=”admin:admin;cluster:secret”
mysql_ifaces=”0.0.0.0:6032″
refresh_interval=2000
cluster_username=”cluster”
cluster_password=”secret”
}
mysql_variables=
{
threads=4
max_connections=2048
default_query_delay=0
default_query_timeout=36000000
have_compress=true
poll_timeout=2000
interfaces=”0.0.0.0:6033;/tmp/proxysql.sock”
default_schema=”information_schema”
stacksize=1048576
server_version=”8.0.23″
connect_timeout_server=3000
monitor_username=”monitor”
monitor_password=”monitor”
monitor_history=600000
monitor_connect_interval=60000
monitor_ping_interval=10000
monitor_read_only_interval=1500
monitor_read_only_timeout=500
ping_interval_server_msec=120000
ping_timeout_server=500
commands_stats=true
sessions_sort=true
connect_retries_on_failure=10
}
proxysql_servers =
(
{ hostname = “proxysql-0.proxysqlcluster”, port = 6032, weight = 1 },
{ hostname = “proxysql-1.proxysqlcluster”, port = 6032, weight = 1 },
{ hostname = “proxysql-2.proxysqlcluster”, port = 6032, weight = 1 }
)
fluent-bit.conf: |
[SERVICE]
Flush 1
Parsers_File /etc/parsers.conf
Log_Level info
Daemon Off
[INPUT]
Name tail
Buffer_Max_Size 5MB
Buffer_Chunk_Size 256k
path /var/lib/proxysql/queries.log.*
DB /var/lib/proxysql/fluentd.db
Parser JSON
[OUTPUT]
Name stdout
Format json_lines
json_date_key timestamp
json_date_format iso8601
Match *
[FILTER]
Name modify
Match *
Rename client source
Rename duration_us duration_query
parsers.conf: |
[PARSER]
Name JSON
Format json
time_key starttime
time_format %Y-%m-%d %H:%M:%S
kind: ConfigMap
metadata:
creationTimestamp: null
name: proxysql-configmap

Terraform:

Create ProxySQL User and Password with Connections from two Subnets

resource “random_password” “password_mysql_proxysql” {
length = 16
special = false
}
resource “aws_secretsmanager_secret” “mysql-podcast_proxysql” {
name = “rtl-plus-podcast/mysql-proxysql-{{environment}}”
description = “ProxySQL Credentials {{environment}} Stage”
}
resource “aws_secretsmanager_secret_version” “mysql-podcast_proxysql” {
secret_id = aws_secretsmanager_secret.mysql-podcast_proxysql.id
secret_string = jsonencode({“user”=”mysql_proxysql_{{environment}}”, “password”=random_password.password_mysql_proxysql.result})
}
resource “mysql_user” “podcast-proxysql” {
provider = mysql.aurora-sl
user = “mysql_proxysql_{{ environment }}”
host = “{{ inventory.parameters.mysql_user_proxysql_host }}”
plaintext_password = random_password.password_mysql_proxysql.result
}
resource “mysql_grant” “podcast-proxysql_user” {
provider = mysql.aurora-sl
user = mysql_user.podcast-proxysql.user
host = mysql_user.podcast-proxysql.host
database = “*”
table = “*”
privileges = [“replication client”]
}
resource “kubernetes_config_map” “proxysql-config-sql” {
metadata {
name = “proxysql-config-sql”
namespace = “squad-rtlplus-podcast”
}
data = {
sql = templatefile(“./proxysql.sql”, {
aurora_domain = “{{ inventory.parameters.aurora_domain }}”
podcast_user_password = random_password.password_mysql_aurora.result
podcast_user_name = mysql_user.podcast-serverless-db.user
proxysql_user_password = random_password.password_mysql_proxysql.result
proxysql_user_name = mysql_user.podcast-proxysql.user
instances = aws_rds_cluster_instance.podcast-serverless-db
})
}
}

resource “null_resource” “restart_proxysql_statefulset” {

provisioner “local-exec” {

command = “kubectl rollout restart statefulset proxysql”

}

lifecycle {

replace_triggered_by = [

kubernetes_config_map.proxysql-config-sql

]

}

}

proxysql.sql

DELETE FROM mysql_aws_aurora_hostgroups;
INSERT INTO mysql_aws_aurora_hostgroups values (0,1,1,3306,'{{inventory.parameters.aurora_domain}}’,600000,1000,3000,0,1,30,30,1,'{{ environment }}’);
SELECT * FROM mysql_aws_aurora_hostgroups;
LOAD MYSQL SERVERS TO RUNTIME;
SAVE MYSQL SERVERS TO DISK;
DELETE FROM mysql_users;
INSERT INTO mysql_users(active,username,password,default_hostgroup,transaction_persistent,use_ssl) VALUES (1,’${podcast_user_name}’,’${podcast_user_password}’,0,0,1);
INSERT INTO mysql_users(active,username,password,default_hostgroup,transaction_persistent,use_ssl) VALUES (1,’root’,’FUiv8yXi7buM0KoD’,0,0,0);
SELECT * FROM mysql_users;
LOAD MYSQL USERS TO RUNTIME;
SAVE MYSQL USERS TO DISK;
DELETE FROM mysql_servers;
{% raw %}
%{ for instance in instances ~}
%{ if instance.writer == true ~}
INSERT INTO mysql_servers(hostgroup_id,hostname,port,use_ssl) VALUES (0,’${instance.endpoint}’,3306,1);
%{ else ~}
INSERT INTO mysql_servers(hostgroup_id,hostname,port,use_ssl) VALUES (1,’${instance.endpoint}’,3306,1);
%{ endif ~}
%{ endfor ~}
{% endraw %}
SELECT * FROM mysql_servers;
LOAD MYSQL SERVERS TO RUNTIME;
SAVE MYSQL SERVERS TO DISK;
UPDATE global_variables SET variable_value=’${proxysql_user_name}’ WHERE variable_name=’mysql-monitor_username’;
UPDATE global_variables SET variable_value=’${proxysql_user_password}’ WHERE variable_name=’mysql-monitor_password’;
UPDATE global_variables SET variable_value=’2000′ WHERE variable_name IN (‘mysql-monitor_connect_interval’,’mysql-monitor_ping_interval’,’mysql-monitor_read_only_interval’);
UPDATE global_variables SET variable_value=’true’ WHERE variable_name=’mysql-have_ssl’;
UPDATE global_variables SET variable_value=’0′ WHERE variable_name=’mysql-set_query_lock_on_hostgroup’;
UPDATE global_variables SET variable_value=’5000′ WHERE variable_name=’mysql-monitor_ping_timeout’;
UPDATE global_variables SET variable_value=’500′ WHERE variable_name=’mysql-throttle_connections_per_sec_to_hostgroup’;
UPDATE global_variables SET variable_value=’5000′ WHERE variable_name=’mysql-default_max_latency_ms’;
UPDATE global_variables SET variable_value=’0′ WHERE variable_name=’mysql-set_query_lock_on_hostgroup’;
UPDATE global_variables SET variable_value=’queries.log’ WHERE variable_name=’mysql-eventslog_filename’;
UPDATE global_variables SET variable_value=’2′ WHERE variable_name=’mysql-eventslog_format’;
UPDATE global_variables SET variable_value=’512′ WHERE variable_name=’mysql-query_cache_size_MB’;
SELECT * FROM global_variables;
LOAD MYSQL VARIABLES TO RUNTIME;
SAVE MYSQL VARIABLES TO DISK;
DELETE from mysql_query_rules;

INSERT INTO mysql_query_rules (active,match_digest,apply,cache_ttl) VALUES (1,’^SELECT’,1,60000);

select t0.*,t0.id from submissions as t0 where (t0.feed\_url = ?) limit ?

INSERT INTO mysql_query_rules (active,digest,destination_hostgroup,apply,cache_ttl) VALUES (1,’0x0C80CCC93E4A6477′,1,1,60000);

select t0.id from episodes as t0 where (t0.uid = ?) limit ?

INSERT INTO mysql_query_rules (active,digest,destination_hostgroup,apply,cache_ttl) VALUES (1,’0x78DDF3A07A7B6E97′,1,1,60000);

select count(*) as count from episodes as t0 limit ?

INSERT INTO mysql_query_rules (active,digest,destination_hostgroup,apply,cache_ttl) VALUES (1,’0x4E91709EE1214CA5′,1,1,60000);

select count(*) as count from podcasts as t0 limit ?

INSERT INTO mysql_query_rules (active,digest,destination_hostgroup,apply,cache_ttl) VALUES (1,’0xB8ED2A71067C2EE5′,1,1,60000);

SELECT ?

INSERT INTO mysql_query_rules (active,digest,destination_hostgroup,apply,cache_ttl) VALUES (1,’0x1C46AE529DD5A40E’,1,1,60000);

select distinct t0.*,t1.podcast\_id from episodes as t0 left join episodes\_podcast\_links as t1 on t0.id = t1.episode\_id where (t1.podcast\_id in (?))

INSERT INTO mysql_query_rules (active,digest,destination_hostgroup,apply,cache_ttl) VALUES (1,’0xA8CF5BFA3D088DFA’,1,1,60000);

INSERT INTO mysql_query_rules (active,digest,destination_hostgroup,apply) VALUES (1,’0x970F45504162F173′,0,1);

INSERT INTO mysql_query_rules (active,digest,destination_hostgroup,apply) VALUES (1,’0x23C7F2C66F50F4A0′,0,1);

INSERT INTO mysql_query_rules (active,digest,destination_hostgroup,apply) VALUES (1,’0xD2247BD720196139′,0,1);

INSERT INTO mysql_query_rules (active,digest,destination_hostgroup,apply) VALUES (1,’0x3465337B476BD70F’,0,1);

INSERT INTO mysql_query_rules (active,digest,destination_hostgroup,apply) VALUES (1,’0xCDC03F9ECEFE25F0′,0,1);

INSERT INTO mysql_query_rules (active,match_digest,destination_hostgroup,apply) VALUES (1,’^SELECT.*FOR UPDATE’,0,1), (1,’^SELECT’,1,1);

INSERT INTO mysql_query_rules (rule_id,active,digest,destination_hostgroup,apply,cache_ttl) VALUES (1,1,’0x357FE2F04F7B1185′,1,1,6000);

INSERT INTO mysql_query_rules (rule_id,active,digest,destination_hostgroup,apply,cache_ttl) VALUES (2,1,’0x7C0DB66C3A8F048D’,1,1,6000);

INSERT INTO mysql_query_rules (rule_id,active,digest,destination_hostgroup,apply,cache_ttl) VALUES (3,1,’0x7346A6D7423B7B87′,1,1,6000);

INSERT INTO mysql_query_rules (rule_id,active,digest,destination_hostgroup,apply,cache_ttl) VALUES (4,1,’0x9210A11FA3CFB6C7′,1,1,6000);

INSERT INTO mysql_query_rules (rule_id,active,digest,destination_hostgroup,apply,cache_ttl) VALUES (5,1,’0x35A086C5312A7AA9′,1,1,6000);

INSERT INTO mysql_query_rules (rule_id,active,digest,destination_hostgroup,apply,cache_ttl) VALUES (6,1,’0xD5B76CB799A8EB07′,1,1,6000);

INSERT INTO mysql_query_rules (rule_id,active,digest,destination_hostgroup,apply,cache_ttl) VALUES (7,1,’0xCECC5BDAB513EB4A’,1,1,6000);

INSERT INTO mysql_query_rules (rule_id,active,digest,destination_hostgroup,apply,cache_ttl) VALUES (8,1,’0xD0DA41F6615CBD24′,1,1,6000);

INSERT INTO mysql_query_rules (rule_id,active,digest,destination_hostgroup,apply,cache_ttl) VALUES (9,1,’0xF06765D077F9D71B’,1,1,6000);

INSERT INTO mysql_query_rules (rule_id,active,digest,destination_hostgroup,apply,cache_ttl) VALUES (10,1,’0x7631E5190F85279E’,1,1,6000);

INSERT INTO mysql_query_rules (rule_id,active,digest,destination_hostgroup,apply,cache_ttl) VALUES (11,1,’0x55F97DEBD03DFBBD’,1,1,6000);

LOAD MYSQL QUERY RULES TO RUNTIME;
SAVE MYSQL QUERY RULES TO DISK;
select * from mysql_query_rules;
SELECT * FROM stats.stats_mysql_connection_pool;
SELECT * FROM monitor.mysql_server_connect_log ORDER BY time_start_us DESC LIMIT 3;
SELECT * FROM monitor.mysql_server_ping_log ORDER BY time_start_us DESC LIMIT 3;

“`

Stream custom logs files with Fluentd sidecar


title: “Stream custom logs files with Fluentd sidecar”
date: 2022-05-31T14:59:51
slug: stream-custom-logs-files-with-fluentd-sidecar


Stream custom logs files with Fluentd sidecar on OpenShift

According to the twelve factor app, it is recommended to stream the logs on stdout. But in some cases, logs are not managed in this way. For example, in the case of middleware, the logs are written inside log files. You could not change this behaviour as you get the container from a third party.

So, on OpenShift, how to get these logs, written on files ?

This article gives you a way to retrieve these logs, written in files, and send them to your log systems. It is based on the use of sidecar that is deployed with the application.

The sample application

To illustrate this article, I’m using a sample application generating some logs in a file. The application code could be located here. It is a simple application written in Go lang.

The logs behaviour could be customised by using environment variables. The LOG variable defines the level of log (debug, info ….). The LOGFILE variable defines where the output of the log will be made. If LOGFILE is empty, stdout is used otherwise, the file referred by the variable is used to collect the logs.

A docker image, including the application is available on docker hub. The image is jtarte/logsample. The building of the image configures the credentials to allow writing on /var/app .

The deployments I use in this article define the application (deployment, pod, service …) and its associated route. You could retrieve the generated route by using oc command. By using a curl command on this route, you could generate workload on the application. For each call, some entries on the log files will be generated.

oc get route -n logsample
curl http://<route\_name>

Deployment of the application

First, you must have an OpenShift cluster configured with the EFK stack. You could find instruction to deploy OpenShift Logging here.

My deployment is done on the logsample namespace. But the namespace where the application is deployed has no impact on the test described in this article.

I deploy the application as is, whithout any sidecar. To do the deployment , I use the following file.

oc apply -f deployment\_simple.yaml -n logsample

If I check the log in the pods using oc log command, nothing is displayed. It is the expected behaviour as the logs are not sent to stdout but on a log file.

oc get pods -n logsample
oc logs <pod\_id> -n logsample

But if I stream the log from the logfile, I could see the log generated by the application.

oc exec-it <pod\_id> -- tail -f /var/app/samplelog.log

And of course, if I do a search about samplelog on Kibana, the only entries I see are related to the deployment of the application that has samplelog as name. Nothing about application logs.

You could clean the environment by using the command:

oc delete -f deployment\_simple -n logsample

Use of a Fluentd sidecar to forward logs on stdout

The solution to collect the application logs, stored in a file, is to use a sidecar. It reads the logs file and streams its contents on its own stdout. In that way, the log messages, generated by the application, are streamed like all the other on stdout and could be collected by the standard EFK stack of the cluster.

The sidecar in the solution is a Fluentd container that is deployed inside the same pod than the application. The two containers share common files system that is defined on each of them as mounting point. In my sample, it is /var/app , know as applog .

spec:
containers:
- name: samplelog
image: jtarte/logsample:latest
imagePullPolicy: "Always"
ports:
- containerPort: 8080
env:
- name: LOG
value: DEBUG
- name: LOGFILE
value: /var/app/samplelog.log
volumeMounts:
- name: applog
mountPath: /var/app/
- name: fluentd
image: fluent/fluentd-kubernetes-daemonset:v1-debian-elasticsearch
env:
- name: FLUENT\_UID
value: "0"
volumeMounts:
- name: fluentd-config
mountPath: /fluentd/etc/fluent.conf
subPath: fluent.conf
- name: applog
mountPath: /var/app/
volumes:
- name: applog
emptyDir: {}
- name: fluentd-config
configMap:
name: fluentd-config

Fluentd behaviour is described into a configuration file, fluent.conf. On my deployment, I use a ConfigMap to store this configuration.

fluent.conf: |
<source>
@type tail
path "/var/app/\*.log"
pos\_file "/var/app/file.log.pos"
tag "kubernetes.samplelog"
<parse>
@type none
</parse>
</source><match kubernetes.samplelog>
@type stdout
</match>

This config is simple. The <source> defines the log collection. The path parameter locates where the logs are. The pos_file is an index managed by fluentd. It gives the position in the logs file from where the next log should be collected. The use of this index ensure that an entry on the log files is processed only one time.

The outpout is very simple as the sample does just a copy on the stdout of the container.

To do the deployment, I use the following file.

oc apply -f kube/deployment\_sidecar\_stdout.yaml

If you are willing to check the logs of the two containers, you could use the following commands:

oc get pods -n logsample
oc logs <pod\_id> -n logsample -c samplelog
oc logs <pod\_id> -n logsample -c fluentd

Nothing is seen inside the samplelog container, as expected because the logs are written into a file. But on the fluentd container, you could see the content of your application logs as it is streamed on stdout by the Fluentd process.

And if you go on the Kibana interface, you could now see logs from samplelog inside all the logs entries.

You could clean the environment by using the command:

oc delete -f deployment\_sidecar\_stdout -n logsample

Use of a Fluentd sidecar to forward logs directly to Elastic

Streaming the logs to stdout is probably better. But sometimes, you may have specific requirements to target a specific log system. Fluentd sidecar could also be used to forward the logs directly to a log management system endpoint. This option may offer some features to customise / manage the forwarded logs. It is done by the sidecar.

The following example is, may be, simple but it will illustrate how to forward logs from the sidecar to the Elasticsearch, deployed on the platform. The process could be similar for an external Eleasticsearch instance. I did it with the one deployed one cluster in order to simplify the exercise and not to have to deploy a second Elasticsearch cluster.

The first step is to get the certificates used to connect Elasticsearch. You get them from the EFK stack configured on the platform.

oc get secret -n openshift-logging fluentd -o jsonpath='{.data.ca-bundle\.crt}' | base64 -d > ca-bundle.crt
oc get secret -n openshift-logging fluentd -o jsonpath='{.data.tls\.crt}' | base64 -d > tls.crt
oc get secret -n openshift-logging fluentd -o jsonpath='{.data.tls\.key}' | base64 -d > tls.key

Then, with the collected certificates, you could create a secret used by the sidecar. It uses the certificates embedded into the secret to manage the authentication to the Elasticsearch instance.

oc create secret generic fluentd --type='opaque' --from-file=ca-bundle.crt=./ca-bundle.crt --from-file=tls.crt=./tls.crt --from-file=tls.key=./tls.key

This secret is used by the Fluentd container definition.

The main difference with the previous case is the configuration of the Fluentd process. It is described inside the ConfigMap. The changes provide information to connect to Elasticsearch service and to forward the log. The logstash parameters are used to defined an index that will be added to the Elasticsearch entry.

<source>
@type tail
path "/var/app/\*.log"
pos\_file "/var/app/file.log.pos"
tag "kubernetes.samplelog"
<parse>
@type none
</parse>
</source><match kubernetes.samplelog>
@type elasticsearch
host elasticsearch.openshift-logging.svc
port 9200
scheme https
ssl\_version TLSv1\_2
client\_key '/var/run/ocp-collector/secrets/fluentd/tls.key'
client\_cert '/var/run/ocp-collector/secrets/fluentd/tls.crt'
ca\_file '/var/run/ocp-collector/secrets/fluentd/ca-bundle.crt'
logstash\_format true
logstash\_prefix samplelog
</match>

To do the deployment, I use the following deployment file.

oc apply -f kube/deployment\_sidecar\_EFK.yaml

After having generate some requests on the application, on Kibana, you could configure a new index named samplelog-*. By filtering the logs with this index, you will see, on the screen, the logs entries related to samplelog application.

The entries, here, are different from the previous try. This time, the entries are formatted by the Fluentd sidecar. The purpose of this article is not to enter in detail of the configuration of Fluentd. If you wish more details on this configuration, you could check the Fluentd documentation.

You could clean the environment by using the command:

oc delete -f deployment\_sidecar\_EFK.yaml -n logsample

Conclusion

This article show a way to retrieve the logs, stored into files inside an application/middlware container. The option to stream the content of log files on stdout is probably better as it is more aligned with what the platform does. It offers loose coupling as it doesn’t have dependencies with a target.

But in some cases, you may have to forward the logs to a specific target and the use of a sidecar could be an option.

So with the processes described in this article, you have a way to get all the logs of your application, even if they are written into files. And you are able to send them to the same place than your standard stdout logs.

References

install k3s


title: “install k3s”
date: 2021-07-04T09:54:22
slug: install-k3s


Install k3 with custom cerificate

curl -sfL https://get.k3s.io | INSTALL\_K3S\_EXEC="--tls-san 213.95.154.184" sh -s -

Uninstall k3s

/usr/local/bin/k3s-uninstall.sh

Get kube config:

cat /etc/rancher/k3s/k3s.yaml

ordoid cgroub pids


title: “ordoid cgroub pids”
date: 2021-01-04T20:58:00
slug: ordoid-cgroub-pids


This guide is only for the NATIVE BUILD. Run it on the board.

Installing building tools

You may need to install the building tools.

$ sudo apt-get install git gcc g++ build-essential libssl-dev bc flex bison

Download and build the kernel source

Updating Kernel and DTB (Device Tree Blob)

Please note that native kernel compile on ODROID-XU4 will take about 25 minutes.

$ git clone --depth 1 https://github.com/hardkernel/linux -b odroidxu4-4.14.y
$ cd linux
$ make odroidxu4\_defconfig
!! changed the .config and enabled CGROUP\_PIDS by adding CONFIG\_CGROUP\_PIDS=y
$ make -j8
$ sudo make modules\_install
$ sudo cp -f arch/arm/boot/zImage /media/boot
$ sudo cp -f arch/arm/boot/dts/exynos5422-odroid\*dtb /media/boot
$ sync

Updating root ramdisk (Optional)

$ sudo cp .config /boot/config-`make kernelrelease`
$ sudo update-initramfs -c -k `make kernelrelease`
$ sudo mkimage -A arm -O linux -T ramdisk -C none -a 0 -e 0 -n uInitrd -d /boot/initrd.img-`make kernelrelease` /boot/uInitrd-`make kernelrelease`
$ sudo cp /boot/uInitrd-`make kernelrelease` /media/boot/uInitrd
$ sync

Before you start with new Linux kernel v4.14

You would check all necessary files are in place as below before reboot. The file size would differ.

$ ls -l /media/boot/
total 14756
-rwxr-xr-x 1 root root 9536 Oct 25 23:29 boot.ini
-rwxr-xr-x 1 root root 753 Aug 20 22:38 boot.ini.default
-rwxr-xr-x 1 root root 62565 Nov 2 01:24 exynos5422-odroidxu3.dtb
-rwxr-xr-x 1 root root 61814 Nov 2 01:24 exynos5422-odroidxu3-lite.dtb
-rwxr-xr-x 1 root root 62225 Nov 2 01:24 exynos5422-odroidxu4.dtb
-rwxr-xr-x 1 root root 61714 Oct 25 23:30 exynos5422-odroidxu4-kvm.dtb
-rwxr-xr-x 1 root root 9996513 Nov 2 01:27 uInitrd
-rwxr-xr-x 1 root root 4844744 Nov 2 01:24 zImage
$ sudo sync
$ sudo reboot

Install containerd for Sandbox Container


title: “Install containerd for Sandbox Container”
date: 2020-12-13T15:19:14
slug: install-containerd-for-sandbox-container


Install gVisor

curl -fsSL https://gvisor.dev/archive.key | sudo apt-key add -
sudo add-apt-repository "deb https://storage.googleapis.com/gvisor/releases release main"
sudo apt-get update && sudo apt-get install -y runsc

Install containerd

wget https://github.com/containerd/containerd/releases/download/v1.4.3/containerd-1.4.3-linux-amd64.tar.gz
tar -xzvf containerd-1.4.3-linux-amd64.tar.gz
cp bin/\* /usr/local/bin
cd /
wget https://github.com/containerd/containerd/releases/download/v1.4.3/cri-containerd-cni-1.4.3-linux-amd64.tar.gz
tar -xzvf cri-containerd-cni-1.4.3-linux-amd64.tar.gz (nach / entpacken)
cp /etc/systemd/system/containerd.service /lib/systemd/system
systemctl enable containerd
mkdir /etc/containerd/
cat <<EOF | sudo tee /etc/containerd/config.toml
disabled\_plugins = ["restart"]
[plugins.linux]
shim\_debug = true
[plugins.cri.containerd.runtimes.runsc]
runtime\_type = "io.containerd.runsc.v1"
EOF
systemctl restart containerd

Install crictl

wget https://github.com/kubernetes-sigs/cri-tools/releases/download/v1.13.0/crictl-v1.13.0-linux-amd64.tar.gz
tar xf crictl-v1.13.0-linux-amd64.tar.gz
sudo mv crictl /usr/local/bin
cat <<EOF | sudo tee /etc/crictl.yaml
runtime-endpoint: unix:///run/containerd/containerd.sock
EOF

Install Kubernetes

apt-get update && apt-get install -y apt-transport-https
curl -s https://packages.cloud.google.com/apt/doc/apt-key.gpg | apt-key add -
cat <<EOF >/etc/apt/sources.list.d/kubernetes.list
deb http://apt.kubernetes.io/ kubernetes-xenial main
EOF
apt-get update
apt-get install -y kubelet kubeadm kubectl
kubeadm init --pod-network-cidr=172.16.0.0/16 --service-cidr=172.17.0.0/18

Configure kubelet for containerd

cat <<EOF | sudo tee /etc/systemd/system/kubelet.service.d/0-containerd.conf
[Service]
Environment="KUBELET\_EXTRA\_ARGS=--container-runtime=remote --runtime-request-timeout=15m --container-runtime-endpoint=unix:///run/containerd/containerd.sock"
EOF
systemctl daemon-reload
systemctl restart kubelet
kubectl taint nodes --all node-role.kubernetes.io/master-

Install the RuntimeClass for gVisor:

cat <<EOF | kubectl apply -f -
apiVersion: node.k8s.io/v1beta1
kind: RuntimeClass
metadata:
name: gvisor
handler: runsc
EOF

Create a Pod with the gVisor RuntimeClass:

cat <<EOF | kubectl apply -f -
apiVersion: v1
kind: Pod
metadata:
name: nginx-gvisor
spec:
runtimeClassName: gvisor
containers:
- name: nginx
image: nginx
EOF

Namespace is in termination state


title: “Namespace is in termination state”
date: 2020-04-13T07:43:26
slug: namespace-is-in-termination-state


Get more Namespace info:

get namespaces rook-ceph -o json
{
"lastTransitionTime": "2020-04-13T06:53:57Z",
"message": "Some resources are remaining: cephfilesystems.ceph.rook.io has 1 resource instances",
"reason": "SomeResourcesRemain",
"status": "True",
"type": "NamespaceContentRemaining"
},
{
"lastTransitionTime": "2020-04-13T06:53:57Z",
"message": "Some content in the namespace has finalizers remaining: cephfilesystem.ceph.rook.io in 1 resource instances",
"reason": "SomeFinalizersRemain",
"status": "True",
"type": "NamespaceFinalizersRemaining"
}
],
"phase": "Terminating"
}

CRD can be deleted ba setting the finalizer to []:

kubectl get crd
NAME CREATED AT
alertmanagers.monitoring.coreos.com 2020-04-11T11:06:08Z
cephfilesystems.ceph.rook.io 2020-04-11T21:12:52Z
kubectl edit crd cephfilesystems.ceph.rook.io

apiVersion: apiextensions.k8s.io/v1
kind: CustomResourceDefinition
metadata:
 creationTimestamp: "2020-04-11T21:12:52Z"
 deletionGracePeriodSeconds: 0
 deletionTimestamp: "2020-04-13T07:08:32Z"
 finalizers:
 - customresourcecleanup.apiextensions.k8s.io
 generation: 1
 managedFields:
 - apiVersion: apiextensions.k8s.io/v1beta1

Modify to:

 finalizers: []

quicker detection of a Node down


title: “quicker detection of a Node down”
date: 2020-04-13T06:53:00
slug: quicker-detection-of-a-node-down


In your Kubernetes cluster a node can die or reboot.

This kind of tools like Kubernetes are high available and designed to be robust and auto recover in such scenarios, and Kubernetes accomplish this very well.

But, you might notice that when a Node gets down, the pods of the broken node are still running for some time and they still get requests, and those requests, will fail.

That time can be reduced, because in my opinion, by default is too high. There are a bunch of parameters to tweak in the Kubelet and in the Controller Manager.

This is the workflow of what happens when a node gets down:

1- The Kubelet posts its status to the masters using –node-status-update-frequency=10s

2- A node dies

3- The kube controller manager is the one monitoring the nodes, using -node-monitor-period=5s it checks, in the masters, the node status reported by the Kubelet.

4- Kube controller manager will see the node is unresponsive, and has this grace period –node-monitor-grace-period=40s until it considers the node unhealthy. This parameter must be N times node-status-update-frequency being N the number of retries allowed for the Kubelet to post node status. N is a constant in the code equals to 5, check var nodeStatusUpdateRetry in https://github.com/kubernetes/kubernetes/blob/e54ebe5ebd39181685923429c573a0b9e7cd6fd6/pkg/kubelet/kubelet.go

Note that the default values don’t fulfill what the documentation says, because:

node-status-update-frequency x N != node-monitor-grace-period   (10 x 5 != 40)

But what i can understand, is that 5 post attempts of 10s each, are done in 40s, the first one in second zero, second one in second 10, and so on until the fifth and last one is done in second 40.

So the real equation would be:

node-status-update-frequency x (N-1) != node-monitor-grace-period

More info:

https://github.com/kubernetes/kubernetes/blob/3d1b1a77e4aca2db25d465243cad753b913f39c4/pkg/controller/node/nodecontroller.go

5- Once the node is marked as unhealthy, the kube controller manager will remove its pods based on –pod-eviction-timeout=5m0s

This is a very important timeout, by default it’s 5m which in my opinion is too high, because although the node is already marked as unhealthy the kube controller manager won’t remove the pods so they will be accessible through their service and requests will fail.

6- Kube proxy has a watcher over the API, so the very first moment the pods are evicted the proxy will notice and update the iptables of the node, removing the endpoints from the services so the failing pods won’t be accessible anymore.

These values can be tweaked so you will get less failed requests if a node gets down.

I’ve set these in my cluster:.

kubelet: node-status-update-frequency=4s (from 10s)

controller-manager: node-monitor-period=2s (from 5s)
controller-manager: node-monitor-grace-period=16s (from 40s)
controller-manager: pod-eviction-timeout=30s (from 5m)

The results are quite good, we’ve moved from a node down detection of 5m40s to 46s